

You can find this report under Conversions section > Ecommerce > Product List Performance. Of course, you wouldn’t find it if you don’t have:
- enhanced ecommerce enabled
- website tagged with the enhanced ecommerce tracking code
- product lists defined within the website (ex. Search list, Category list, Recently Viewed Products list, etc.)
The Product List Performance report in Google Analytics V3 is the place where you can see how many times a product showed up within a list (product impressions), how many times was clicked (product clicks), added to cart, went to checkout and how many times was bought. Pretty cool, right?
But how exactly the product impressions are counted? Can we trust those numbers in the report or should we question that metric?
Let’s look at this process in more detail.
All started when a client of ours in the real estate vertical wanted to implement an internal system which will provide a widget containing fitted properties for the users when browsing their website. How will the client know if a user is suited to receive a personalized recommendation? Well, we had implemented a system which attributed points to that user depending on his actions on the website but this is a subject to another article.
Having this recommendation system in mind we started to develop the tracking plan and picture how the data will be reported in Google Analytics in a manner that could offer insights for the business. The main idea was to raise the number of leads per user meaning that a user will contact more agencies than before because it is supposed that he will receive better properties recommendations within that widget.
After analyzing the tracking plan we concluded that a big issue will be the Product List Performance report and let’s see why.
The widget itself is a list because it loads a list of properties so we had to implement product impressions and product clicks from enhanced ecommerce.
When a list of products is loaded we send this information to Google Analytics by sending a request containing the object structure as described in the Enhanced Ecommerce documentation for Product Impressions.
This object can be composed by scratching the DOM and grabbing the product info or by reading the information from dataLayer if available.
This request is sent when a product is loaded in the DOM, not when a user is actually seeing the product which makes a huge difference.
We wanted to measure the performance of the widget but it will be correct to compare 2 widgets in this scenario:
- One loaded in the DOM, not viewed by the user: 1 product impressions, 0 product clicks, 0 leads
- The other one viewed by the user in viewport: 1 product impressions, 1 product click, 1 lead
This example wouldn’t have told us the widget performance.
So what did we do?
First of all we had to be sure that we will collect product impressions only when a widget enters in the user’s viewport. For that to happen we’ve created a script (custom HTML type in GTM) that can detect when a property is in viewport and grabs product information that we need to build productImpressions object.
This is how it works:
window.scrollingTracker = {
itemSelector: ‘.box-recomandate’, //Implementation DEPENDENT
currentItemSelector: null,
itemIdAttr: ‘data-id-cod’, //Implementation DEPENDENT
itemNameAttr: ‘data-name’, //Implementation DEPENDENT
itemPriceAttr: ‘data-price’, //Implementation DEPENDENT
itemPositionAttr: ‘data-position’, //Implementation DEPENDENT
itemBrandAttr: ‘data-camere’, //Implementation DEPENDENT
itemCategoryAttr: ‘data-judet’, //Implementation DEPENDENT
itemSourceAttr: ‘data-recomandation-source’, //Implementation DEPENDENT
itemListAttr: ‘data-id-list’,
itemVariantAttr: ‘data-zona’,
itemOffsetLimit: 0.3, //Implementation DEPENDENT
scrollTimeLimit: 500, //Implementation DEPENDENT
lastScrollTimestamp: 0,
timeoutID: null,
visitedElems: {}
};
In the above code we’ve declared the keys that we will use to structure the data we need.
itemSelector: ‘.box-recomandate’
Is selecting the element where the recommended properties appeared. It is implementation dependent so you should change its value.
currentItemSelector: null
This key is set null by default because further in the script it will be assigned a value of “itemSelector”. Why? Because we will collect the value of properties entered in the viewport only once even though the user is scrolling up and down and the property is viewed multiple times.
itemIdAttr: ‘data-id-cod’, //Implementation DEPENDENT
itemNameAttr: ‘data-name’, //Implementation DEPENDENT
itemPriceAttr: ‘data-price’, //Implementation DEPENDENT
itemPositionAttr: ‘data-position’, //Implementation DEPENDENT
itemBrandAttr: ‘data-camere’, //Implementation DEPENDENT
itemCategoryAttr: ‘data-judet’, //Implementation DEPENDENT
itemSourceAttr: ‘data-recomandation-source’, //Implementation DEPENDENT
itemListAttr: ‘data-id-list’,
itemVariantAttr: ‘data-zona’,
These are the property attributes that will be used in building the productImpressions object.
itemOffsetLimit: 0.3,
This means that we are collecting the property information when is 70% visible in the viewport
scrollTimeLimit: 500,
We set a minimum time limit for a property to stay in the viewport. You can change this at whatever time you want but we considered if a property stays half a second in the user’s view port it is enough time for that property to be noticed and to attract the user’s attention.
function gaIsElementInViewport(el) {
var top = el.offsetTop;
var left = el.offsetLeft;
var width = el.offsetWidth;
var height = el.offsetHeight;
// console.log(top + ” ” + left + ” ” + width + ” ” + height);
while (el.offsetParent) {
el = el.offsetParent;
top += el.offsetTop;
left += el.offsetLeft;
}
var itemOffsetHeightMargin = window.scrollingTracker.itemOffsetLimit * height;
return (
top >= (window.pageYOffset – itemOffsetHeightMargin) &&
left >= window.pageXOffset &&
(top + height) <= (window.pageYOffset + window.innerHeight + itemOffsetHeightMargin) &&
(left + width) <= (window.pageXOffset + window.innerWidth)
);
}
Afterwards we’ve declared a function that will help us further in the script to calculate the distance from the page top and left to the selected widget.
function getElementsInViewport() {
if(window.scrollingTracker.currentItemSelector === null) {
window.scrollingTracker.currentItemSelector = window.scrollingTracker.itemSelector;
}
var elems = document.querySelectorAll(window.scrollingTracker.currentItemSelector);
var el = [];
for (var i = 0; i < elems.length; i++) {
var elId = elems[i].getAttribute(window.scrollingTracker.itemIdAttr);
var elName = elems[i].getAttribute(window.scrollingTracker.itemNameAttr);
var elPrice = elems[i].getAttribute(window.scrollingTracker.itemPriceAttr);
var elPosition = i + 1;
var elBrand = elems[i].getAttribute(window.scrollingTracker.itemBrandAttr);
var elVariant = elems[i].getAttribute(window.scrollingTracker.itemVariantAttr);
var elList = elems[i].getAttribute(window.scrollingTracker.itemListAttr);
var elCategory = elems[i].getAttribute(window.scrollingTracker.itemCategoryAttr);
var elSource = elems[i].getAttribute(window.scrollingTracker.itemSourceAttr);
if (window.scrollingTracker.visitedElems[elId] !== 1) {
if (gaIsElementInViewport(elems[i])) {
//console.log(elId);
window.scrollingTracker.visitedElems[elId] = 1;
el.push({
‘id’: elId,
‘name’: elName,
‘price’: elPrice,
‘position’: elPosition,
‘category’: elCategory,
‘variant’: elVariant,
‘brand’: elBrand,
‘list’: elList,
‘dimension53’: elSource,
‘metric5’: 1
});
}
}
}
if (el.length != 0) {
// console.log(el);
dataLayer.push({
‘ecommerce’: {
‘impressions’: el
},
‘event’: ‘productVisibility’,
});
}
}
This is where the magic happens.
The script is pushing to the dataLayer the enhanced ecommerce product impressions object that we need to collect only when the property is visible for the user in the viewport.
You can see that we are also sending ‘metric5’: 1 in order to count how many times a property was viewed in the viewport. We use this metric for calculation of the following metrics:
- Property List Views Seen (custom metric)
- Property List Views Seen Ration (calculated metric)
- Property List CTR (calculated metric)
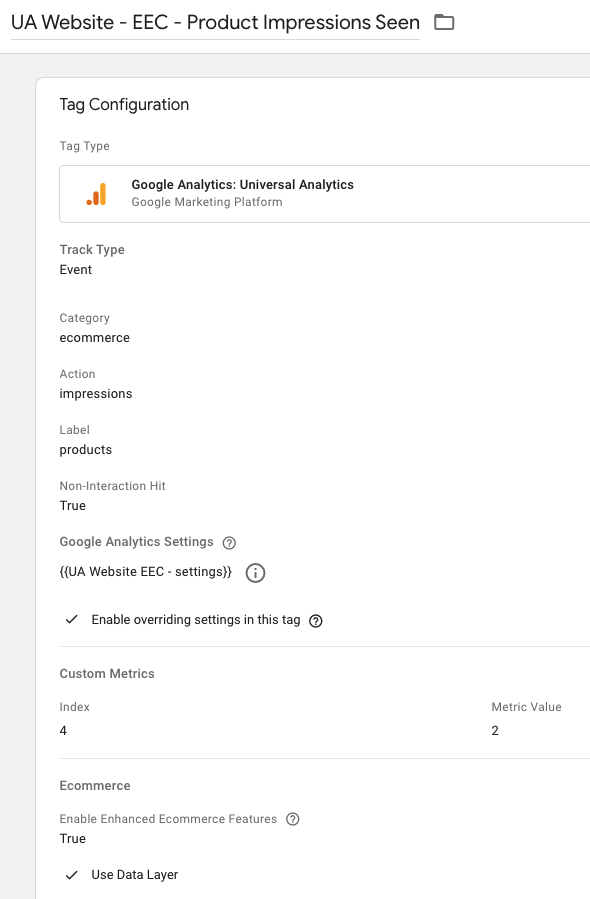
To collect the data we created the following tag in GTM in which we checked the “Use Data Layer” feature so the information we sent by the custom HTML tag to be read and sent in Google Analytics.
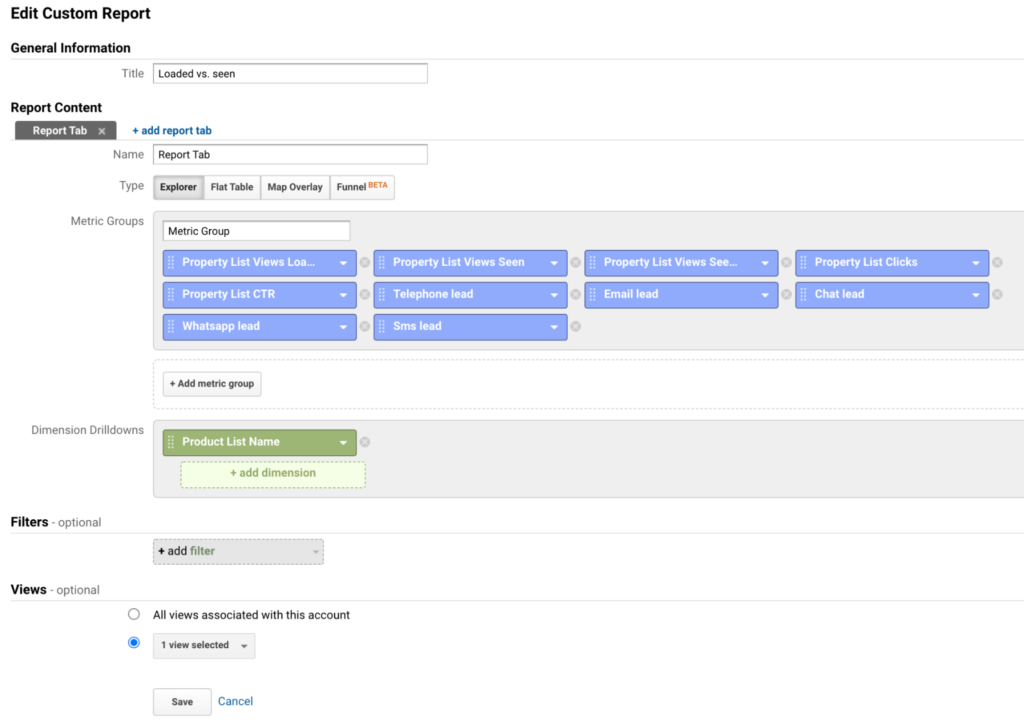
Last step was to create a custom report with the setup like the one below.
And this is the report that we got in the end.
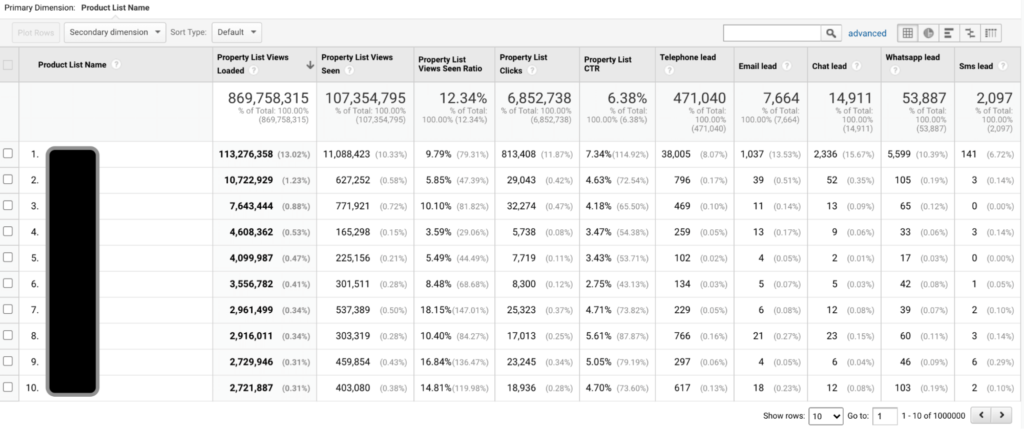
As you can see, only 12.34% of the properties loaded in the website are visible to the user. This is a great insight that can be used in many ways:
- a much lower number of properties can be loaded within a list without to affect the user experience but to improve the site performance
- rearrangement of the pagination
- slots customization and so on…That being said, we can see clearly that the Product List Performance report as it is now in Google Analytics holds just half of the truth. A more customized solution is needed in order to measure in an accurate way the performance of the product lists (whatever a product may be).