One of the most common situations we encounter in case-studies and white-papers brands and agencies present early to the marketing industry festivals and competitions are those in which authors admit they underestimated KPIs and read results as an overachievement.

If we move beyond the obvious explanation, that which points out to the need to impress the jury with extraordinary results of the project/campaign, we can talk about an interesting phenomena, relevant for dealing with the topic of this article.
We are used to being relatively ok with wrong estimations, as long as they serve a purpose, we accept the results were much more than intended, we are ok with the idea that, based on preliminary data, we cannot generate more than an estimated hypothesis, that accounts for not much further on.
But is this really ok?
How do we approach and address cognitive biases and data fallacies?
Let’s start with a short definition of data fallacies:
According to the definition, fallacies generated by data analysis and interpretation are small involuntary lies that viciate our thinking and conclusions.
One of the methods of exploration of this rather large subject is by taking a look at what an initial estimation means, what is a hypothesis and how we can read and interpret the data to validate or contradict and improve this hypothesis. More so, not only look at where the process can be corrupted, but also identify the pain points and consciously avoid them.
In other words, the main objective of a data analyst is to see where the cognitive errors are hidden and make sure not to fall for them. Nothing easier.
The framework and mindset example – the ROI
In the process of data analysis we start from a question that attends to a need-to-know. Next, we define a hypothesis to confirm or invalidate, following the classic approach of the scientific method: we observe a data-set, we state an objective, define the hypothesis and construct arguments based on data available.
We will take the following example to demonstrate the steps:
We look at the initial investment of a brand in communicating a new product. What we want is to find out which of the paid-media channels brought the greatest return-on-investment, or, in other words, what channel has the best ROI?
The working hypothesis is that channels that focus on conversion (performance channels) have the greatest ROI, because they generated more revenue. The next step is to validate (or contradict) the hypothesis based on available data. Further, we select the metrics that point to the relevant data and extract our arguments. So far, so good.
But what happens if, at this step, we introduce another attribute? In our case, how do the arguments change if we introduce the organic results / direct results? Is the initial hypothesis still valid?
Being aware of the possible cognitive bias makes one aware of additional information and mechanisms related to data.

- At one point, the investment reaches a maximum target – a so-called critical relevant mass, a level over which growth is impossible, no matter the actions taken or the budget increase.
- Therefore, pushing for a bigger investment in the performance campaigns will indeed up the ROI but not because of a market share increase, but because it will overlap the organic/direct segment. In effect, when performance channels grow in importance relative to the ROI, the organic segment decreases.
- The other way around, when the investment in performance decreases, the organic segment goes up. Evidently, when both performance and organic expand, we are experiencing market share growth.
Identifying the 3 possible scenarios is only possible if we are aware of the biases we can face when we want to influence the relationship between ROI, the value of the investment and the critical mass capping.
Practice – Simpson’s paradox
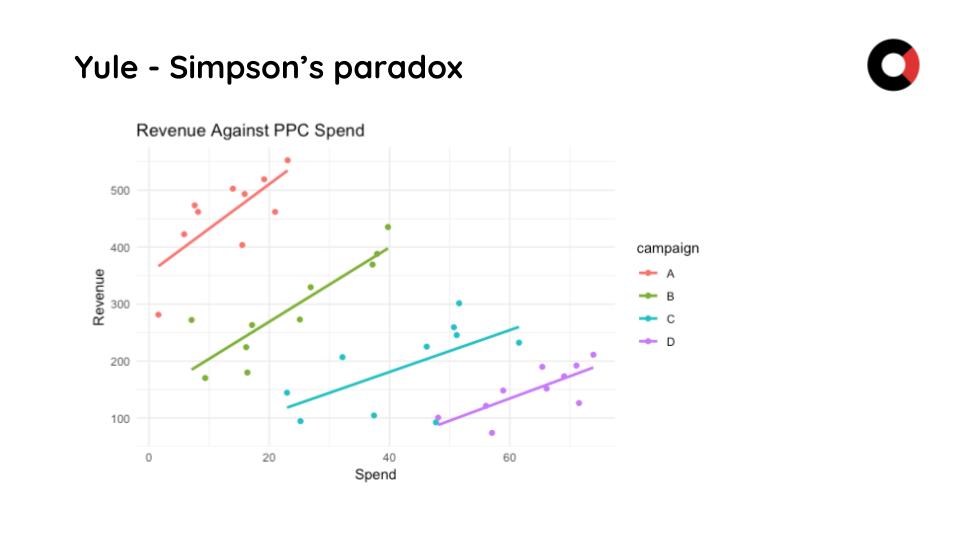
Definition: Simpson’s paradox, which also goes by several other names, is a phenomenon in probability and statistics in which a trend appears in several groups of data but disappears or reverses when the groups are combined.
Another very telling example of a bias is underlined by the Simpson’s paradox, in which a hypothesis is both true and false at the same time.
To exemplify this, we will work with the following hypothesis:
The investment in performance channels has a positive effect on revenue and the Spend/Revenue ratio is satisfactory.
If we analyse the general trend in the graph below, we can see that the revenue is on a downward trend, while the spend trend is upward.
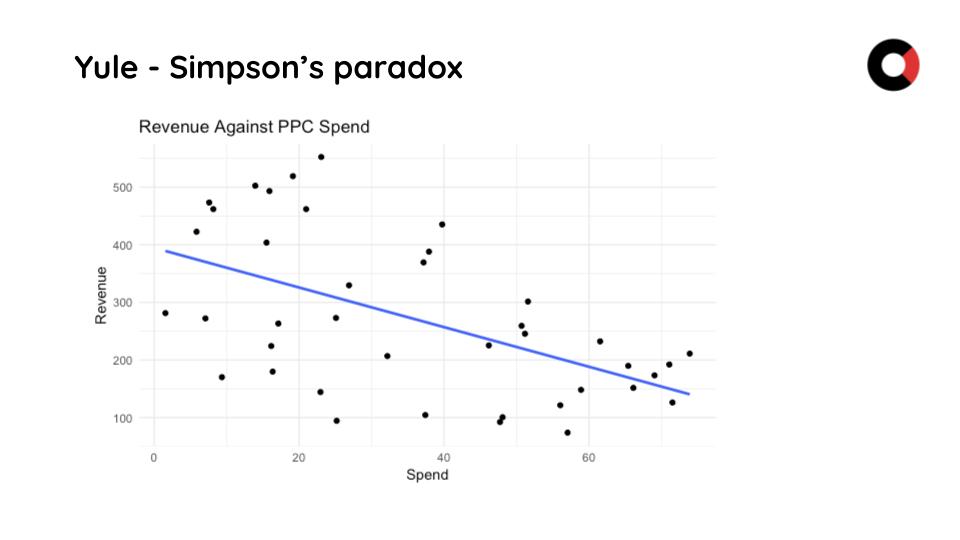
We can see that regression is true when we analyse the data set as a whole, but when we find the optimal revenue point for the spend I want, there are 4 different data segments to analyse.
If we dismiss this 1st cognitive fallacy and analyze further by adding another attribute to the mix – for example <new buyer: how many new 1st time buyers PPC brought>, we will get access to a new type of insight: how many of those new buyers will become “more than one time buyer”.
Consequently, we realize that the 20k revenue is only a segment of the whole, and if we take into account the loyalty factor – for example, if we have a 66% new-buyers rate, suddenly a 50% ROI becomes a very good ratio.
To conclude, we can observe how this new insight, generated by avoiding a false causality and analysing more than the obvious data will further render the hypothesis as true and justify a decision to keep the investment in PPC channels at the same level, or even increase it.
In the second part of the article to see what happens when the conclusion of our analysis is invalidated by a whole different analysis process and we will further analyze different data fallacies.
Stay tuned for Part II!