Back to blog
Analytics
Loaded vs. seen products - User clusters project
·
You can find this report under Conversions section > Ecommerce > Product List Performance. Of course, you wouldn’t find it if you don’t have:
- enhanced ecommerce enabled
- website tagged with the enhanced ecommerce tracking code
- product lists defined within the website (ex. Search list, Category list, Recently Viewed Products list, etc.)
- One loaded in the DOM, not viewed by the user: 1 product impressions, 0 product clicks, 0 leads
- The other one viewed by the user in viewport: 1 product impressions, 1 product click, 1 lead
In the above code we’ve declared the keys that we will use to structure the data we need.
itemSelector: '.box-recomandate’
Is selecting the element where the recommended properties appeared. It is implementation dependent so you should change its value.
currentItemSelector: null
This key is set null by default because further in the script it will be assigned a value of “itemSelector”. Why? Because we will collect the value of properties entered in the viewport only once even though the user is scrolling up and down and the property is viewed multiple times.
itemIdAttr: 'data-id-cod', //Implementation DEPENDENT
itemNameAttr: 'data-name', //Implementation DEPENDENT
itemPriceAttr: 'data-price', //Implementation DEPENDENT
itemPositionAttr: 'data-position', //Implementation DEPENDENT
itemBrandAttr: 'data-camere', //Implementation DEPENDENT
itemCategoryAttr: 'data-judet', //Implementation DEPENDENT
itemSourceAttr: 'data-recomandation-source', //Implementation DEPENDENT
itemListAttr: 'data-id-list',
itemVariantAttr: 'data-zona',
These are the property attributes that will be used in building the productImpressions object.
itemOffsetLimit: 0.3,
This means that we are collecting the property information when is 70% visible in the viewport
scrollTimeLimit: 500,
We set a minimum time limit for a property to stay in the viewport. You can change this at whatever time you want but we considered if a property stays half a second in the user’s view port it is enough time for that property to be noticed and to attract the user's attention.
function gaIsElementInViewport(el) {
var top = el.offsetTop;
var left = el.offsetLeft;
var width = el.offsetWidth;
var height = el.offsetHeight;
// console.log(top + " " + left + " " + width + " " + height);
while (el.offsetParent) {
el = el.offsetParent;
top += el.offsetTop;
left += el.offsetLeft;
}
var itemOffsetHeightMargin = window.scrollingTracker.itemOffsetLimit * height;
return (
top >= (window.pageYOffset - itemOffsetHeightMargin) &&
left >= window.pageXOffset &&
(top + height) <= (window.pageYOffset + window.innerHeight + itemOffsetHeightMargin) &&
(left + width) <= (window.pageXOffset + window.innerWidth)
);
}
Afterwards we’ve declared a function that will help us further in the script to calculate the distance from the page top and left to the selected widget.
function getElementsInViewport() {
if(window.scrollingTracker.currentItemSelector === null) {
window.scrollingTracker.currentItemSelector = window.scrollingTracker.itemSelector;
}
var elems = document.querySelectorAll(window.scrollingTracker.currentItemSelector);
var el = [];
for (var i = 0; i < elems.length; i++) {
var elId = elems[i].getAttribute(window.scrollingTracker.itemIdAttr);
var elName = elems[i].getAttribute(window.scrollingTracker.itemNameAttr);
var elPrice = elems[i].getAttribute(window.scrollingTracker.itemPriceAttr);
var elPosition = i + 1;
var elBrand = elems[i].getAttribute(window.scrollingTracker.itemBrandAttr);
var elVariant = elems[i].getAttribute(window.scrollingTracker.itemVariantAttr);
var elList = elems[i].getAttribute(window.scrollingTracker.itemListAttr);
var elCategory = elems[i].getAttribute(window.scrollingTracker.itemCategoryAttr);
var elSource = elems[i].getAttribute(window.scrollingTracker.itemSourceAttr);
if (window.scrollingTracker.visitedElems[elId] !== 1) {
if (gaIsElementInViewport(elems[i])) {
//console.log(elId);
window.scrollingTracker.visitedElems[elId] = 1;
el.push({
'id': elId,
'name': elName,
'price': elPrice,
'position': elPosition,
'category': elCategory,
'variant': elVariant,
'brand': elBrand,
'list': elList,
'dimension53': elSource,
'metric5': 1
});
}
}
}
if (el.length != 0) {
// console.log(el);
dataLayer.push({
'ecommerce': {
'impressions': el
},
'event': 'productVisibility',
});
}
}
This is where the magic happens.
The script is pushing to the dataLayer the enhanced ecommerce product impressions object that we need to collect only when the property is visible for the user in the viewport.
You can see that we are also sending 'metric5': 1 in order to count how many times a property was viewed in the viewport. We use this metric for calculation of the following metrics:
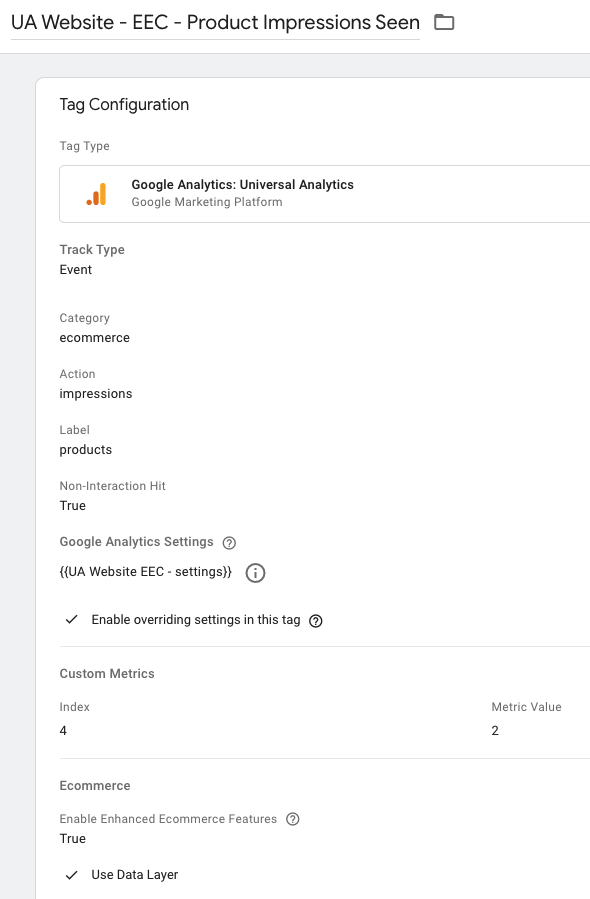
- Property List Views Seen (custom metric)
- Property List Views Seen Ration (calculated metric)
- Property List CTR (calculated metric)
Last step was to create a custom report with the setup like the one below.
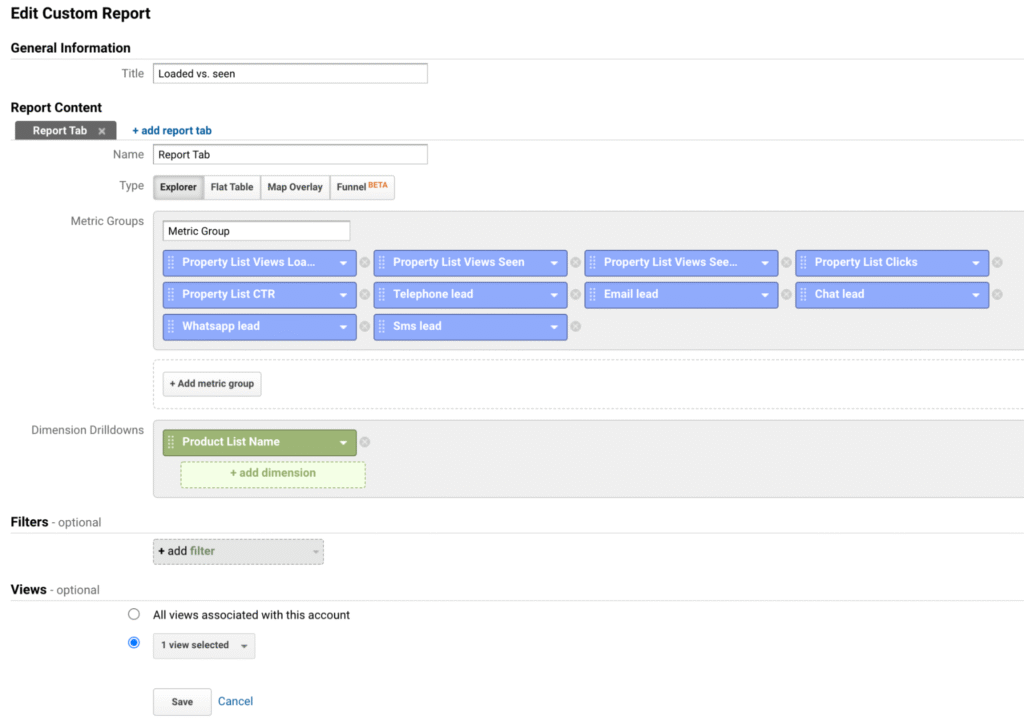
And this is the report that we got in the end.

As you can see, only 12.34% of the properties loaded in the website are visible to the user. This is a great insight that can be used in many ways:
- a much lower number of properties can be loaded within a list without to affect the user experience but to improve the site performance
- rearrangement of the pagination
- slots customization and so on…That being said, we can see clearly that the Product List Performance report as it is now in Google Analytics holds just half of the truth. A more customized solution is needed in order to measure in an accurate way the performance of the product lists (whatever a product may be).